
In the age of “big data,” marketing agencies are faced with the challenge of reporting on digital campaigns that have countless data points. Agencies and marketing teams need to be transparent about all aspects of campaign performance, but looking at every possible metric can draw focus away from the true goals of a campaign.
So how does HDMZ report on campaign performance in a way that helps the client measure success without overwhelming them? Here are a few tips to help you avoid the dreaded data dump and create a story from data.
Focus on KPIs
Every campaign starts with an objective, such as: “thought leadership,” “awareness,” “lead generation”, etc. It is a digital marketer’s job to tie that “goal” to a measurable KPI. For example:
Objective → Establish thought leadership by promoting a white paper
KPI → White Paper Downloads
Dial in the focus of your reporting to these relevant metrics and the factors that impact them. In other words, don’t get sidetracked analyzing impression data if your goal is downloads.
Put Metrics in Context
Why are these metrics important? Who are they important to?
In the case of a white paper, in order for a user to download this piece of content they would typically need to fill out a form. Each form fill is leveraged as a new lead for a sales team which can then be turned into a purchase.
Downloads → Sales Prospect → Purchase/Revenue
Find Patterns in the Data
Here are some questions you can ask to help find patterns in digital campaign performance:
- What channels are reaching/exceeding performance benchmarks?
- How does investment impact performance?
- What channels have the best return on investment (cost per conversion)?
- Who is engaging with the content?
- Is it the right people?
- What elements are underperforming compared to the rest of the initiative, and how can this be used to educate my client?
Turn the Numbers into Insightful Visuals
Now that you have established what metrics are necessary to report on and what patterns/insights we can get from those metrics, it’s time to visualize!
By following these simple steps you can take a crazy amount of data and turn it into an easy to digest story.
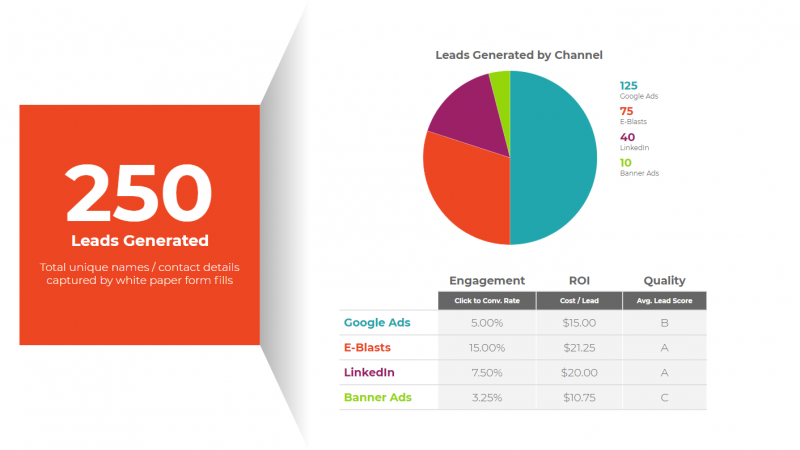
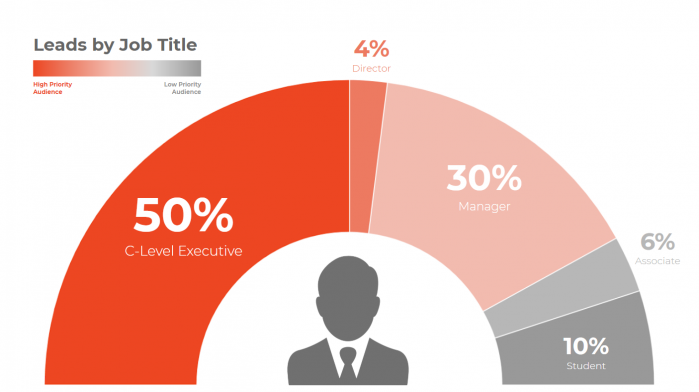
For instance, in the above graphics, it was easy to tell:
- This campaign generated 250 unique leads/sales prospects
- 1 in 2 leads came from Google Ads
- LinkedIn and E-Blasts generated the highest quality leads
- 84% of total leads are part of a “priority” audience
At HDMZ, we hold ourselves accountable to the right data, told in the right way to be easily digested and actionable. Drop us a line below if we can collaborate to elevate your data!