
In this uniquely challenging time, we’ve been working with clients to increase digital presence as we shift traditional budgets away from in-person moments that no longer exist. This is a universal, cross-industry undertaking, of course, challenging every marketer to find new ways to capture attention in the moments that matter.
The impact of budgets shifting to digital has not been fully digested by the industry, but there are some initial trends. We’ve pulled together some benchmarks and observations for Twitter, in particular, because of its increased importance during the pandemic’s initial news cycles in Q1 2020.
Topics we’re covering below:
- Twitter CPC/CPM benchmarks (Q1 2020 vs. Q4 2019, and YoY)
- Observations from a large client’s promoted posts on Twitter
- [screenshots] ASCO, AACR, and other Sponsored Tweets seen in the wild
- ASCO 2020 Twitter Roundup
Twitter benchmarks Q2 2019 thru Q1 2020
Given the increase of Twitter usage and the decrease of advertising spend early this year, we were curious as to the shift of benchmarks. According to AdStage, these are the Q1 2020 benchmarks from Twitter:
| CPC | CPM | CTR | |
|---|---|---|---|
| Q1 2020 vs. Q4 2019 | ↑122% | ↓12% | ↓61% |
| Q1 2020 vs. Q1 2019 | ↑47% | ↑14% | ↓20% |
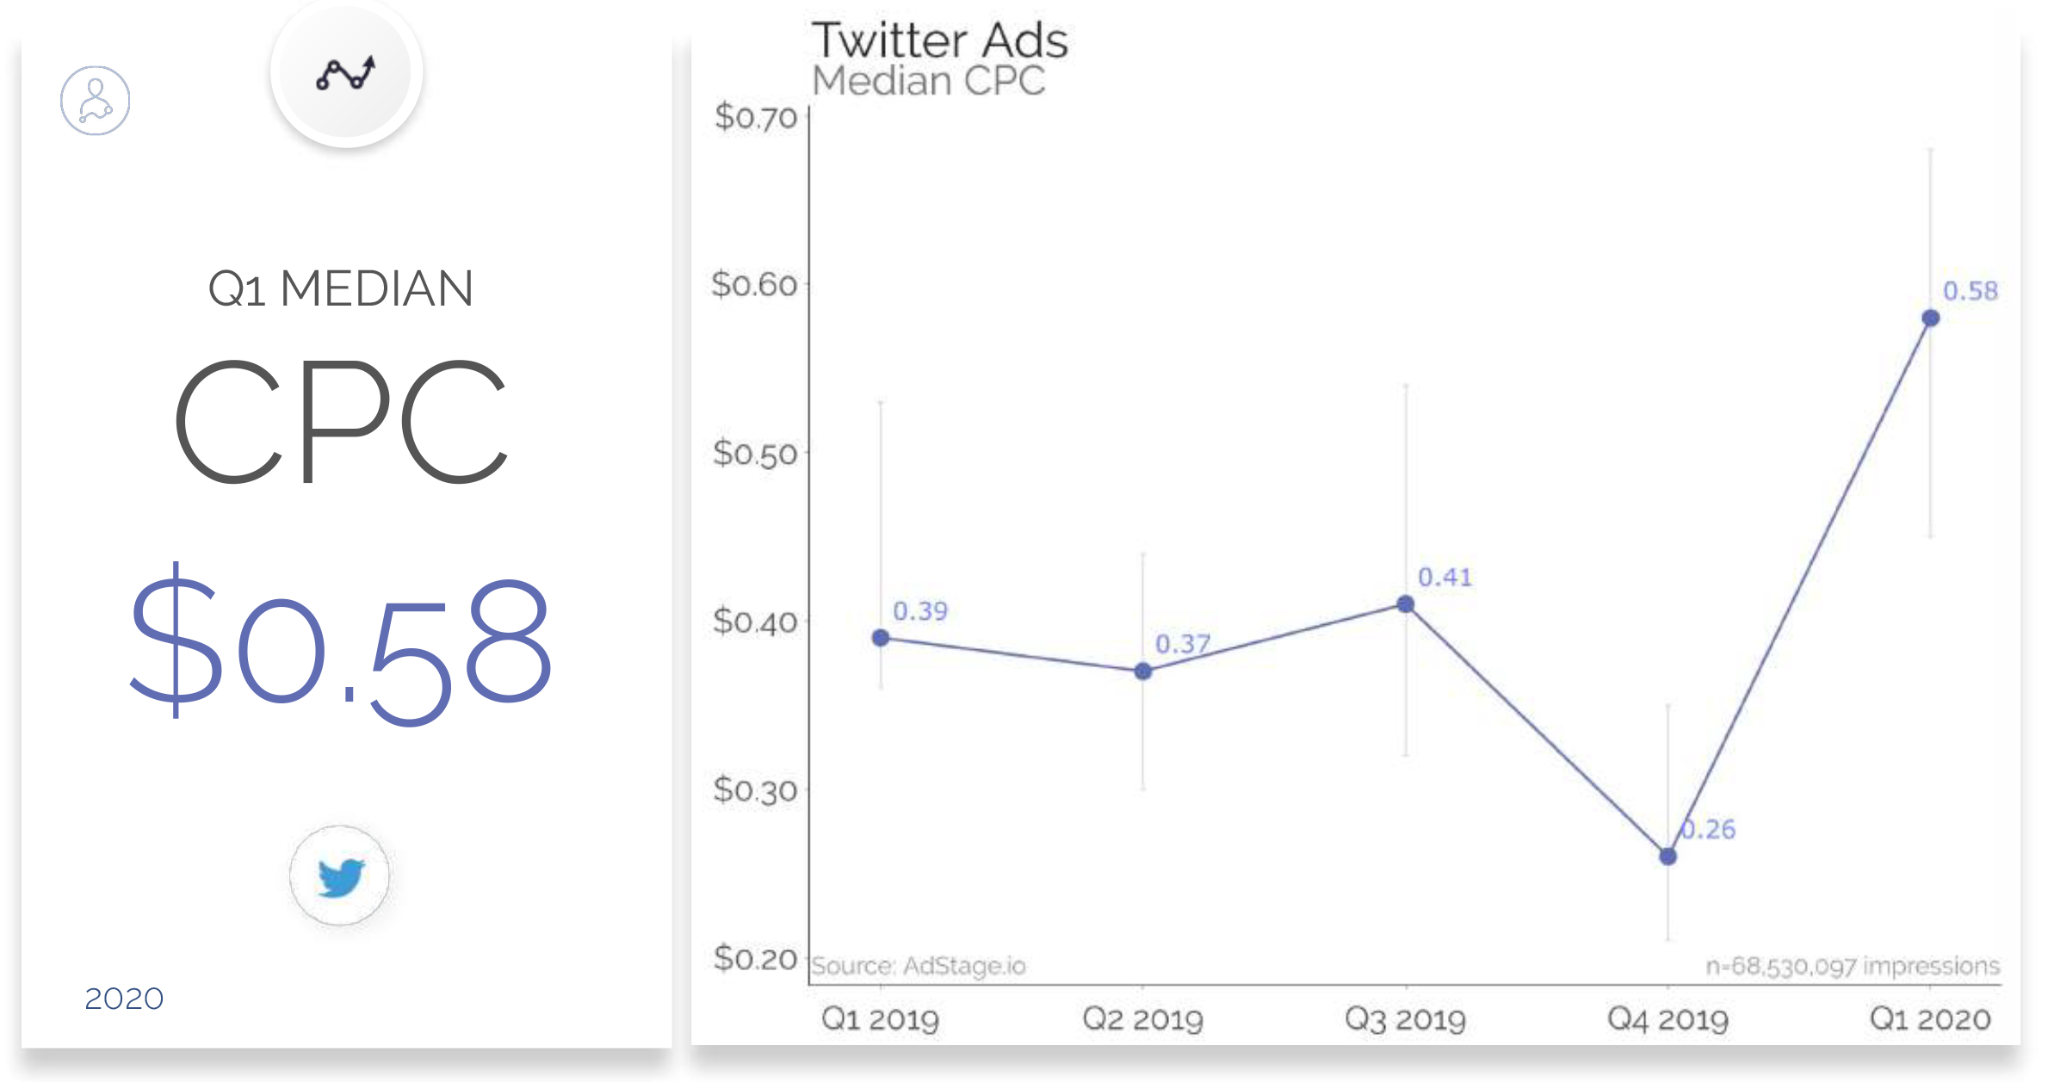
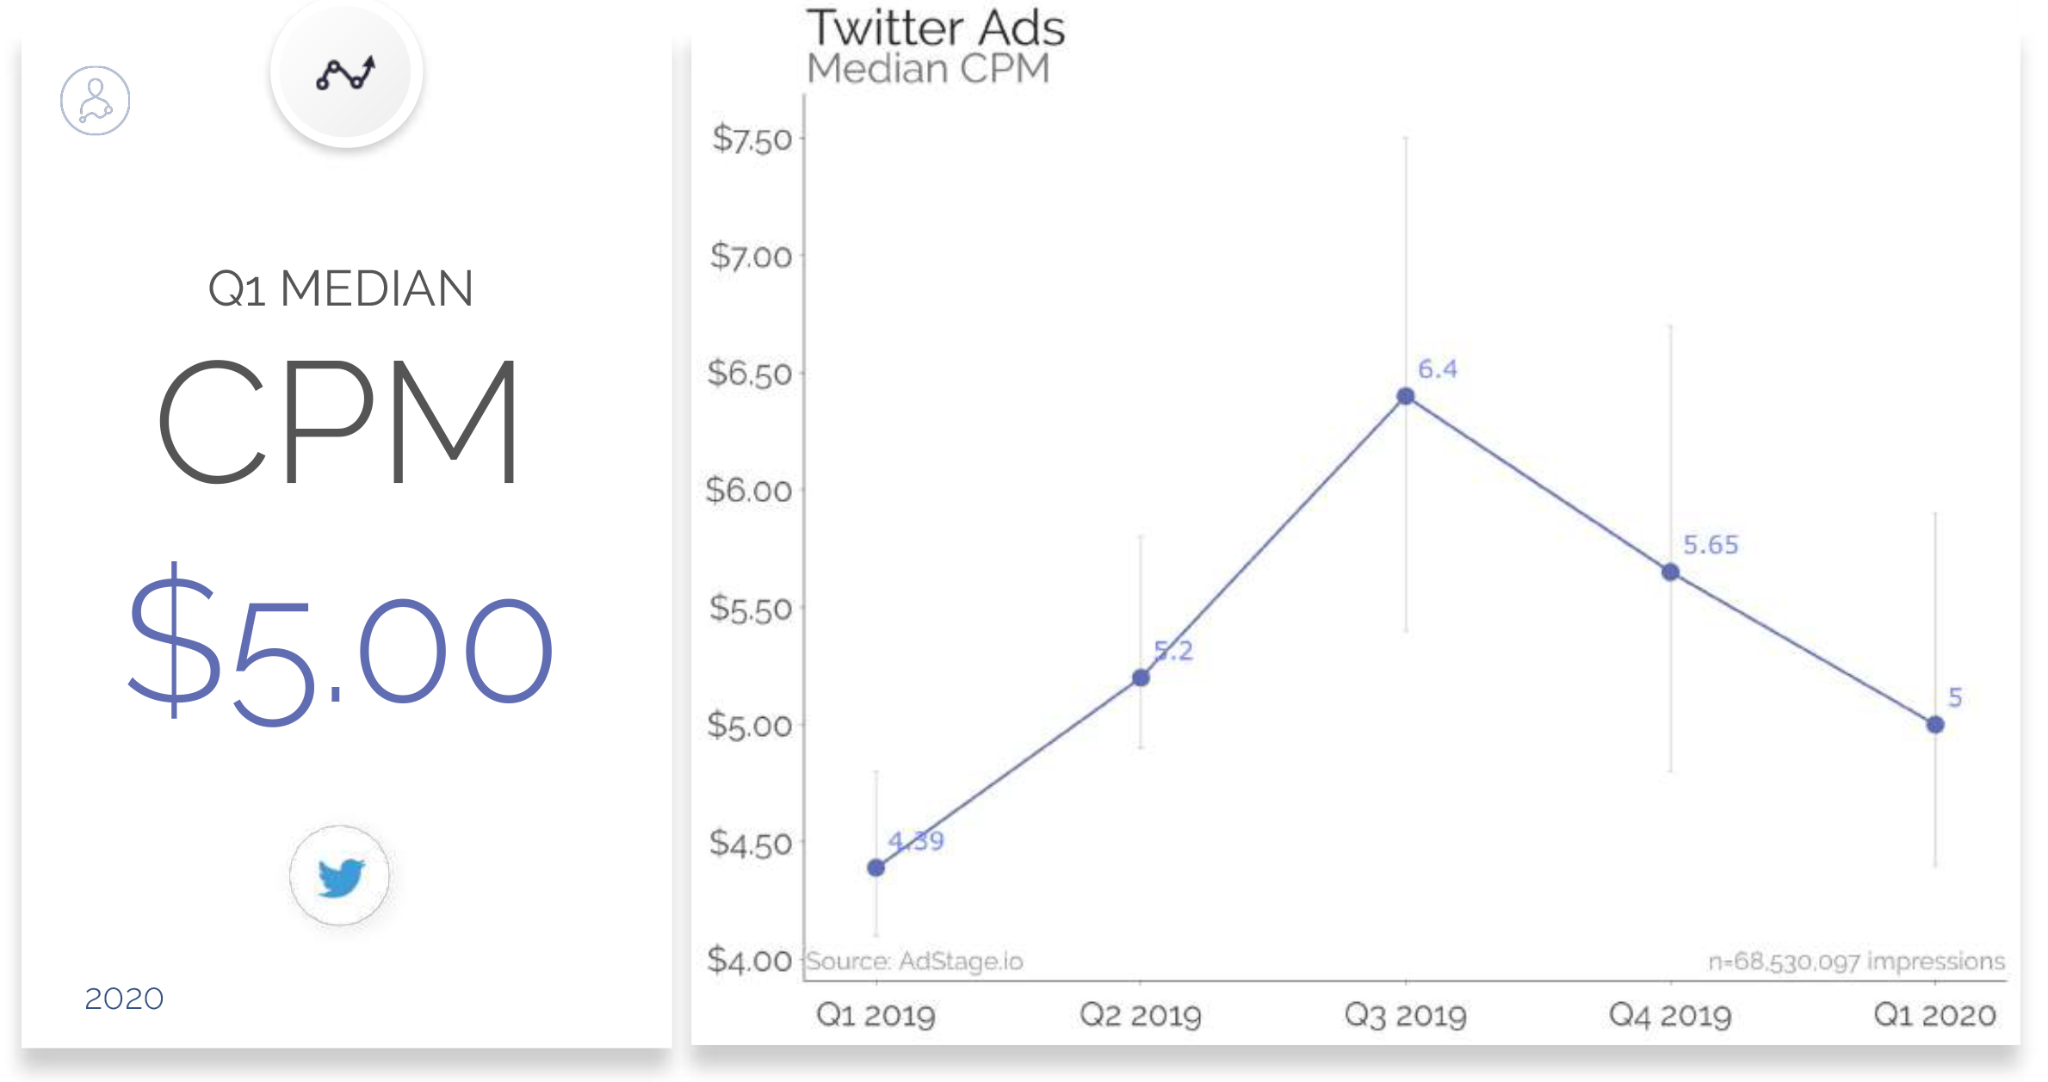
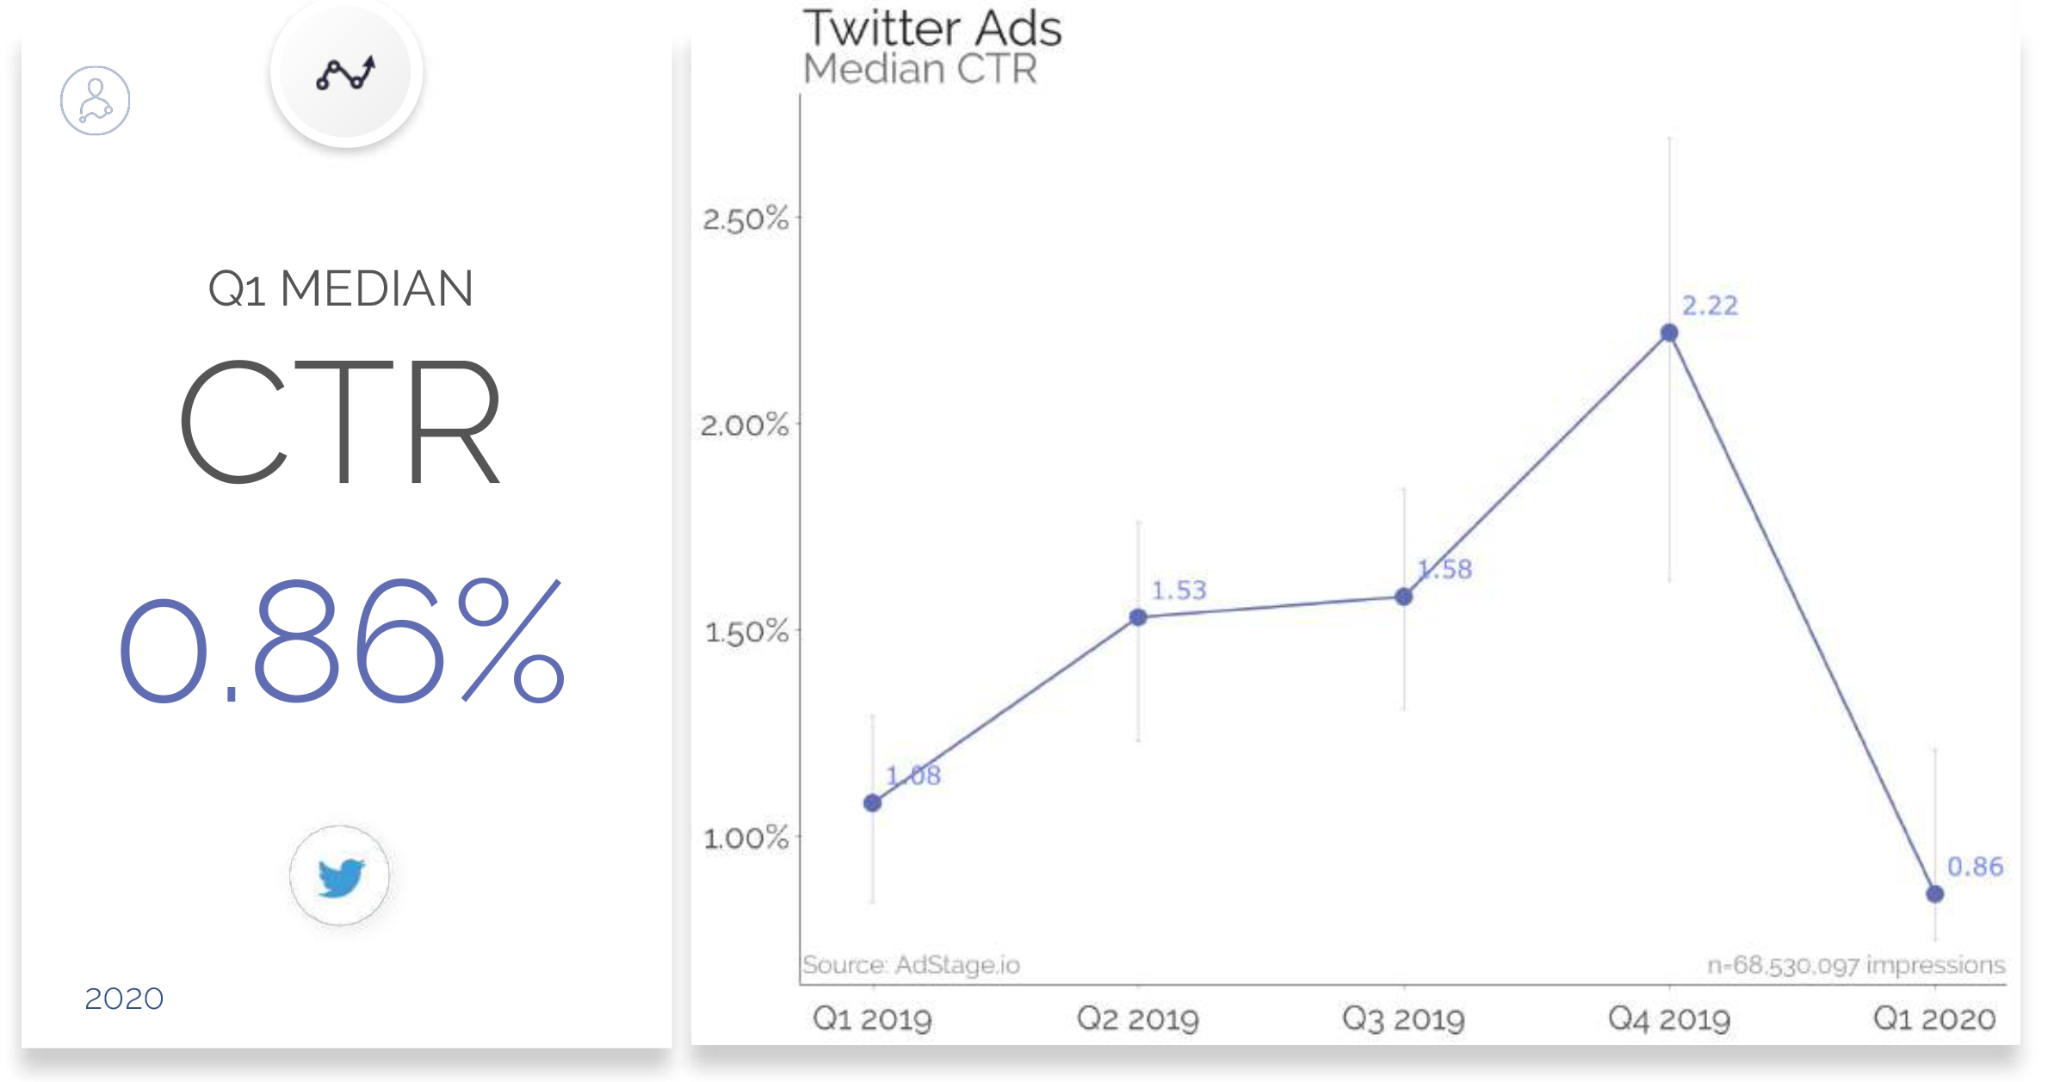
Source: AdStage, Q1 2020 Benchmarks
Clearly, the impact on Twitter ad costs and engagement has been profound. Will we continue to see these trends in Q2 2020? We wondered what our agency data might tell us…
Observations from a client’s promoted posts on Twitter
For one of our larger clients, we’ve had consistent promoted post Twitter Ad campaigns running since early in Q4 2019. Capturing a birds-eye snapshot of all aggregated campaigns (across audiences and objectives), we overlaid a graph of total COVID hashtagged tweets from TweetBinder:
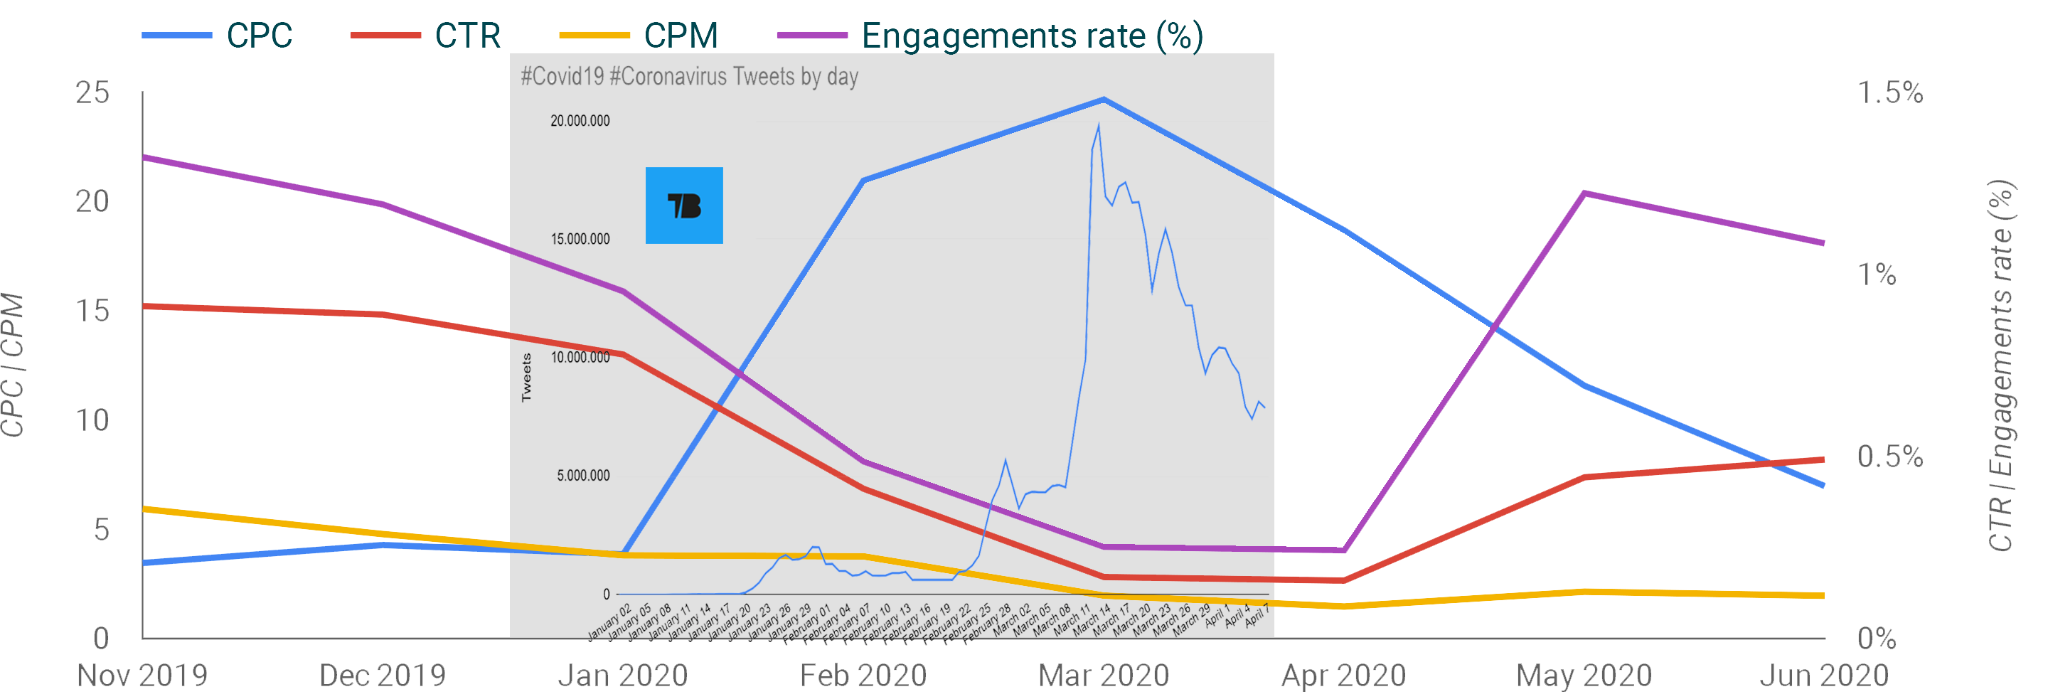
A few notable trends appear, all of which correlate with observed and expected patterns during this tumultuous time:
- Overall engagements (clicks, social engagements) dropped steeply during the heaviest months of Coronavirus content.
- The old adage seems to hold true here: when engagement goes down, costs tend to rise. Most of our campaigns are run on a CPC basis (aiming to drive users to relevant content), which likely anchored cost increases to the CPC metric (while CPMs dropped).
- On a promising note, engagement has trended upwards since May.
[screenshots] ASCO, AACR, and other Sponsored Tweets seen in the wild
It’s worth noting that this deep dive into Twitter trends was prompted by a personal observation of an increasing number of ads. For the most part, I’m targeted more or less correctly between digital marketing and the life sciences spheres, but the overall quantity of healthcare and pharma ads I’ve seen (relative to the daily/weekly time I’ve spent on Twitter) has without a doubt increased in frequency.
Here are some screenshots of the various ads and communications strategies I’ve observed:
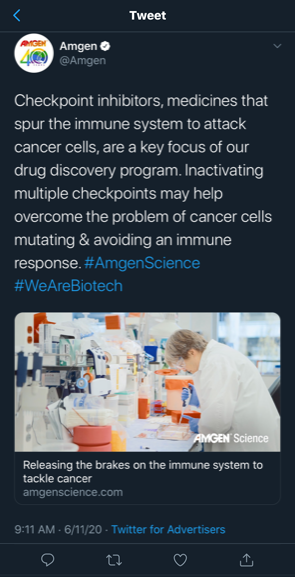


Notably, the types of communications varied across a wide range of communications, everything from a corporate-branded “follower” campaign, various collaboration announcements, webinars, patient portals, product promos, and scientific data releases, to name a few.
We wondered what the data could show us specifically about the shift from in-person events to digital-only channels. The annual standout conference, ASCO, held some interesting data tidbits. Read on…
ASCO tweet data 2019 vs 2020
One of the trends we noticed in the increase of ads was the number of ASCO-related promoted posts. Of course, with in-person conferences being cancelled and abruptly substituted for digital approximations, it isn’t a surprising trend. But what do the numbers say?
From Symplur’s Healthcare Hashtag Project (2019 vs. 2020):
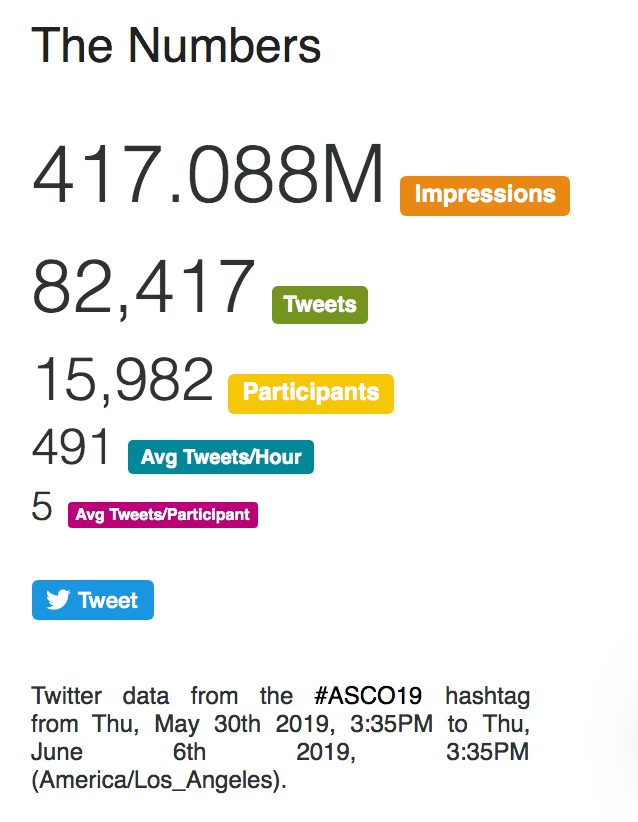
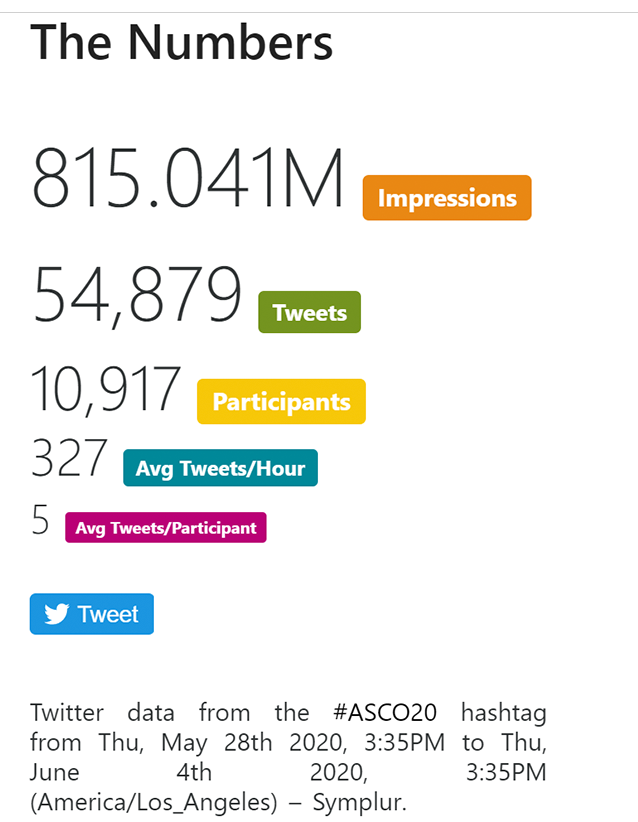
Remarkably, comparing the same dates in 2019 and 2020, we see about ⅔ as many tweets and active participants, but twice as many impressions. Perhaps this could be attributed to sponsored posts, which can forcibly reach more eyes than a typical year, which may leverage a stronger Organic presence.
That’s a Wrap… for now
That’s all the data we’ve gathered to share, for now. We’ll continue to watch these trends, and look forward to the release of Q2 2020 benchmarks and studies that provide a little more insight into the digital trends fomented by the pandemic.
Have questions on this data or want to take advantage of Twitter’s sponsored content for your audience? We love to talk data: drop us a line below!